Machine Utilization & Labor Efficiency Calculator
Measure how well your machines and operators are performing. Enter available hours, actual production hours, and units produced to instantly calculate utilization rate and labor efficiency — built for US manufacturers.
Free Tool · US Manufacturing · Machine Utilization · Labor EfficiencyTotal scheduled hours the machine/shift is available. Example: 1 shift × 5 days × 8 hrs = 40 hrs/week. Excludes planned idle time (nights, weekends).
Hours the machine or operator was actively producing. Subtract downtime, changeovers, breaks, and idle wait time from available hours.
Total good parts or assemblies produced in the period. Use good output only — exclude scrap and rework for a true efficiency picture.
Your standard or engineered rate — how many units per hour this machine or operator should produce under normal conditions.
What These Metrics Measure — and Why They Matter
Machine utilization and labor efficiency are two separate but equally important KPIs in US manufacturing. Understanding the difference is key to diagnosing production problems and improving margins.
Labor Efficiency (%) = (Actual Output ÷ Standard Output) × 100
Standard Output = Standard Rate (units/hr) × Actual Production Hours
Lost Units = Lost Hours × Standard Rate
1 Machine Utilization
Tells you what percentage of scheduled time the equipment is actually running. A utilization of 75% means the machine is idle or down 25% of the time it's supposed to be running — costing you parts and money without reducing your overhead.
2 Labor Efficiency
Tells you how fast your operators are producing compared to the standard rate. An efficiency of 90% means workers are producing 90 units for every 100 the standard expects. This can reflect training level, part complexity, or process issues.
3 Why They're Different
You can have high utilization (machine runs all day) but low efficiency (slow output rate). Or high efficiency (fast when running) but low utilization (machine stops frequently). You need both metrics to get the full picture of your operation.
4 Lost Units = Real Money
Every idle hour at your standard rate is units you didn't make but still paid overhead for. Quantifying lost units makes the business impact of downtime concrete — helping you justify investment in maintenance, tooling, or staffing changes.
Most lean practitioners target 80–85% machine utilization for single-shift operations. Chasing 100% is a trap: it eliminates buffer for maintenance, changeovers, and demand spikes, leading to breakdowns and missed shipments. Focus on consistent utilization, not maximum utilization. For high-volume automated processes like injection molding or stamping, targets can be set higher (85–92%) because changeover times are shorter and maintenance windows are more predictable.
Utilization & Efficiency Benchmarks (US Manufacturing)
3 Real-World Examples (US Manufacturing)
Available hours = 40 hrs/week (1 shift, Mon–Fri) | Actual production hours = 31 hrs | Output = 620 parts
Standard rate = 22 parts/hr | Standard output = 682 parts
Machine Utilization = 77.5% (31 ÷ 40 × 100) · Labor Efficiency = 90.9% (620 ÷ 682 × 100)
Lost hours = 9 hrs · Lost units ≈ 198 parts. Verdict: Efficiency is strong; work on reducing changeover and setup time to push utilization above 80%.
Available hours = 80 hrs/week | Actual production hours = 71 hrs | Output = 9,800 parts
Standard rate = 145 parts/hr | Standard output = 10,295 parts
Machine Utilization = 88.75% · Labor Efficiency = 95.2%
Lost units ≈ 1,305 parts from 9 hrs of idle time. Verdict: World-class performance. Remaining idle time is likely planned maintenance — exactly right.
Available hours = 40 hrs/week | Actual production hours = 26 hrs | Output = 390 assemblies
Standard rate = 18 units/hr | Standard output = 468 units
Machine Utilization = 65% · Labor Efficiency = 83.3%
Lost units = 252 assemblies — a significant revenue gap. Verdict: Both metrics are below target. Likely causes: material wait time, rework loops, or unclear work instructions. Immediate process review recommended.
Typical US Industry Benchmarks
| Process / Operation | Typical Utilization | Typical Efficiency | Key Downtime Drivers | Status |
|---|---|---|---|---|
| CNC Machining (1 shift) | 72% – 82% | 85% – 95% | Tool changes, setup, programming | Acceptable |
| Injection Molding (2 shift) | 82% – 92% | 88% – 97% | Mold change, material drying | Strong |
| Stamping / Press Brake | 70% – 85% | 80% – 92% | Die setup, material coil loading | Acceptable |
| Manual Assembly | 65% – 80% | 75% – 90% | Material wait, rework, training gaps | Acceptable |
| Welding Cell | 60% – 78% | 75% – 88% | Fixture setup, spatter cleaning | Needs Focus |
| US Manufacturing Average | ~75.5% | — | Varies by sector | Acceptable |
Frequently Asked Questions
Machine utilization measures what percentage of scheduled available time a machine is actually running. OEE (Overall Equipment Effectiveness) goes further by multiplying three factors: Availability (similar to utilization), Performance (actual speed vs. ideal speed), and Quality (good parts vs. total parts).
Think of it this way: utilization tells you if the machine is running; OEE tells you if it's running well and producing good parts. A machine can have 90% utilization but poor OEE if it runs slowly or produces a lot of scrap. This calculator covers utilization and efficiency — for a full OEE score you would also need to track your scrap and quality rate separately.
Available hours (also called Scheduled Hours or Planned Production Time) is the total time the machine is scheduled to run. This excludes planned non-production time — nights, weekends, holidays, and planned shutdowns. For a single 8-hour shift, Monday through Friday, available hours = 40 hrs/week.
Actual production hours is the time the machine was actively producing parts. Subtract from available hours: unplanned breakdowns, tooling changes, extended setups, material shortages, and idle/waiting time. The gap between the two is your lost time — categorizing why that time was lost (breakdown vs. changeover vs. no material) is the first step to reducing it.
For most US manufacturing operations, the widely accepted target is 80–85% machine utilization for a planned single-shift operation.
Why not 100%? Running at or above 95% leaves no buffer for planned maintenance, tool changes, or demand spikes. World-class lean operations deliberately leave 10–15% buffer capacity to maintain flow, enable predictive maintenance, and absorb schedule variability. Sustained near-100% utilization typically leads to unplanned downtime, quality problems, and operator fatigue — all more expensive than the lost capacity buffer.
For high-volume automated processes like injection molding or stamping, targets can be set higher (85–92%) because changeover times are shorter and maintenance windows are more predictable.
The standard rate should represent the output a trained operator on a properly maintained machine can achieve under normal conditions — not a theoretical maximum, and not a minimum floor. The most common methods used in US shops are:
- Time studies: Directly observe and time an experienced operator over multiple cycles. Average the results, then apply an allowance factor (typically 10–15%) for fatigue and minor delays.
- Historical data: Review production records from your best consistent performers over a 90-day period — not the all-time record, but a reproducible rate.
- Engineered standards: Use cycle time data from your process (machine cycle + load/unload) to calculate the theoretical rate, then apply an efficiency factor.
The standard rate should be reviewed at least annually and updated when process changes, tooling improvements, or equipment upgrades materially change cycle times.
Yes — with a simple adjustment. For a multi-operator line, the standard rate you enter should reflect the expected output of the entire line (the bottleneck rate), not one individual station. Similarly, the actual output should be the line's actual completed-unit output, and available/actual hours should reflect the shift duration.
To analyze individual operator efficiency within the cell, run the calculator separately for each station using that station's own standard rate and output data. This helps you identify which station is constraining the line.
Based on manufacturing industry data and common shop floor observations, the most frequent culprits for low machine utilization in US manufacturing are:
- Unplanned breakdowns / reactive maintenance: The #1 cause. Switching from reactive to preventive maintenance programs typically recovers 5–15% utilization.
- Long or unplanned changeovers: Especially on job-shop CNC and stamping operations. SMED methodology targets sub-10-minute changeovers.
- Material shortages / late deliveries: Machine is ready, operator is ready — but no material to run. Improve inventory buffers and supplier lead time tracking.
- Programming and setup delays: CNC shops often lose 1–3 hours per job on program prove-out. Offline programming and standardized setup sheets reduce this significantly.
- Quality holds and rework loops: When parts go on hold waiting for inspection or engineering disposition, the machine stops. Faster quality feedback loops reduce this delay.
Start by categorizing your lost hours by cause for at least two weeks. The data will almost always reveal one or two dominant causes responsible for 60–70% of your idle time — focus there first.
Related Manufacturing Tools
Top Picks for CNC Router Tooling
Professional-grade carbide tools ready to ship. Click any product to view details and pricing.
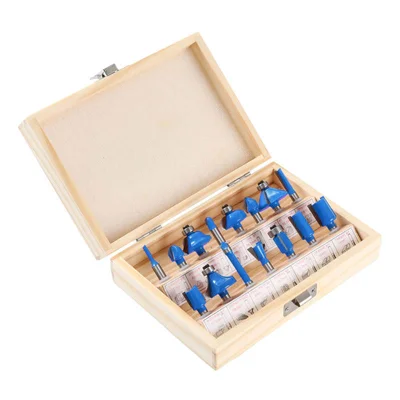
15-Piece Router Bit Set
Multi-size starter kit with carrying case
View on Alibaba →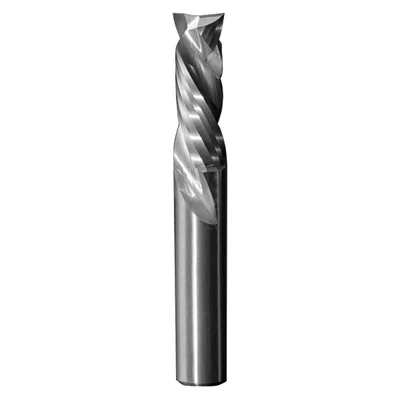
Compression Spiral Bits
Clean edges on plywood & MDF
View on Alibaba →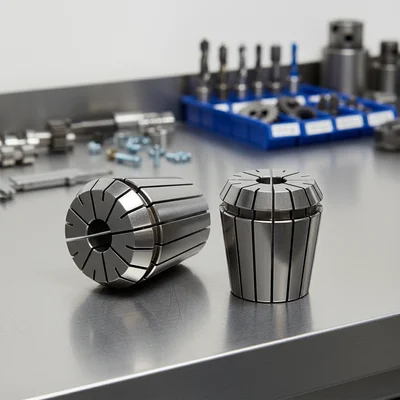
ER Collet Set
Precision holding, zero runout
View on Alibaba →As an Alibaba affiliate partner, we earn from qualifying purchases at no cost to you.